At some point in our career as Web developers we’ve been asked to add a visual representation of data, commonly known as charts. Charting is an integral part of a line of business application. They represent data in a subtlety manner, making easier to interpretcompiled dataand make decisions from it. A chart can take a large variety of forms, however there are common features that provide the chart with its ability to extract meaning from data.
There are many options to render data on your Web application depending on your needs. We are going to discuss some of the options and see an example of how to do it on an ASP.NET MVC project. This might help us choose from the overwhelming offer of free components out there.
Doesn’t Microsoft provide free charting tools?
The answer is YES, but they are available as server-side controls for ASP .NET Webforms. After Microsoft acquiring Dundas Software, a couple of years ago, they where introduced on the previous .NET framework release (v3.5) and made formally part of the framework on the latest release (v4.0). Scott Guthrie describes the control in this blog post.
Certainly this charting control can be incorporated into ASP.NET MVC with ease.There’s been a lot of discussion about ways of achieving this.The solution boils down to just needing to reference theDataVisualization assembly and the handler for rendering the chart image on the web.config.
But doesn’t this feel a littleout of place? Specially for the purpose of this framework? It’s like all of the sudden Mr. Postback is right around the corner of becoming a special needed feature of your ASP.NET MVC application. Ironic isn’t it?
Other options in the charting world
Parting from this, many options exist, in order to fulfill this "must have" requirement. There are many flavors to choose from, when it comes to free charting libraries. Just to mention a few: Google Charting Tools, amCharts, Open Flash Charts, Flot, JSCharts…
Breaking them down!
Google Charting Tools are a good option. They’re pretty straight forward to use and understand. Google also provides a visualization playground where you can get more intimate with the API and all its features.
Flot is a jQuery plugin simple to use and renders awesome looking charts. If you’re used to working with jQuery, this will be heaven for you. It displays a wide variety of charting options and programming utilities like feedback of the points clicked on the chart area. Go grab it now!
amCharts its a fancy looking solution. They have a huge palette of options for rendering data. Their charts also can have animations. If you want to use these you have to be willing to get your hands dirty in order to get this beast tamed. These charts are highly configurable, therefore you have to work with to separated XML files to get them working: one for the data and one for the chart configuration.
Open Flash Chart now this is the FULL package, it has it all. It renders the charts in flash but embraces the use of JSON as the data file, which makes them a perfect candidate for JavaScript tweaking. Also being completely open source, like Flot, encourages developers to create libraries and extend their functionality. There’s a library built for .NET already available for download on the linked site.
Isn’t this a technical blog? Show me some code!
Just to be coherent, after praising Open Flash Charts, I’m choosing this package to feature on my example.
In order to start, let’s be clear on what we need:
- Open Flash Chart swf object.
- An Open Flash Chart library that outputs JSON formatted chart objects. (Open Flash Chart .NET library preferably, just to avoid the wheel reinvention)
And that’s it!!!
So let’s start by getting the whole thing from the Open Flash Chart's site download section. This will provide us with the charts swf object and different libraries for different languages and implementations.
After unpacking your download go straight to the "dot-net-library" directory and extract the DLL from the "OpenFlashChart" library project. There’s also a WebForms project that you can run and see implementations of all the library available options.
So following the tutorial we need to embed the OpenFlashChart.swf object to our webpage. To do so I chose the swfObject JavaScript library, which can be imported to the desired view or the site’s master page from Google's CDN.
<script type="text/javascript" src="http://ajax.googleapis.com/ajax/libs/swfobject/2.1/swfobject.js">
</script>
After importing the swfobject library we just need to embed our flash object like this:
<script type="text/javascript">
    swfobject.embedSWF("open-flash-chart.swf", "my_chart", "250", "200", "9.0.0");
</script>
This tutorial shows how data can be passed to the chart using a data file explicitly instead of using the query string which is the default way of specifying the file.
Instead of using that code directly on our views I’d rather use another approach, which consists on creating a Html helper to render the chart. I’ve gone ahead and created a static extension class in order to extend the ASP.NET MVC's Html Helper, here’s the code for my method.
#region OpenFlashChart
public static string RenderChart(
    this HtmlHelper helper,
    // This is the id of the html container where the chart is going to be rendered preferably a div.
    string chartContainer,
    // This is the route to the chart JSON formatted data
    string chartData,
    // This is the chart width
    int width,
    // This is the chart height
    int height,
    // This is chart's the loading text
    string loadingText = "Loading data...")
{
        var chart = new StringBuilder();

        // Creating the script tag
        var script = new TagBuilder("script");

        // Adding the type attribute
        script.Attributes.Add("type", "text/javascript");

        // Setting the swf object definition for the open flash chart
        string swfobject = "swfobject.embedSWF(" +
                    "\"/Content/swf/open-flash-chart.swf\"," + //This can be set from a config file or w/e
                    "\""+ chartContainer +"\"," +
                    "\""+ width +"\"," +
                    "\""+ height +"\"," +
                    "\"9.0.0\"," +
                    "\"/Content/swf/expressInstall.swf\"," +
                    "{ \"data-file\": \""+ chartData +"\", \"loading\":\"" + loadingText + "\" }" +
                ");";

        // Setting the inner text of the script tag without HTML encoding
        script.InnerHtml = swfobject;

        // Appending the script tag to the helper result
        chart.Append(script);

        // Returning the open flash chart client code implementation
        return chart.ToString();
}
#endregion
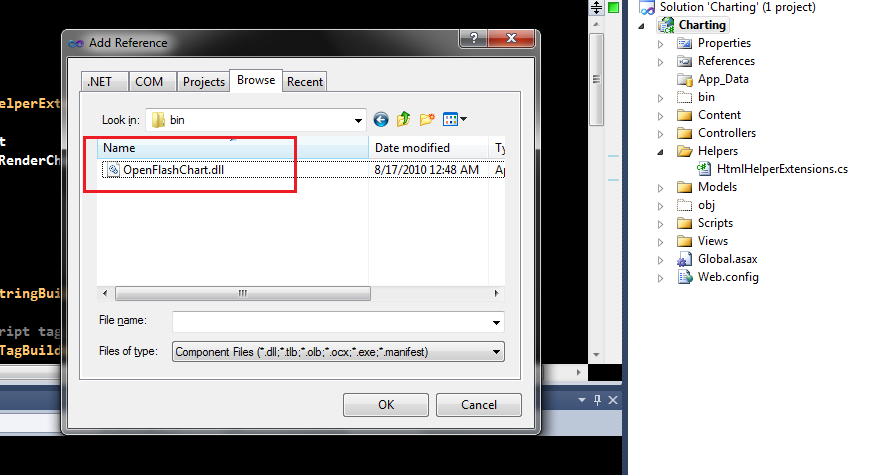
Now that we have our helper to render the chart it’s time to copy the corresponding files. First move the open-flash-chart.swf to the Content/swf directory as well as the flash expressInstall file. And then add a reference to the extracted OpenFlashChart library.
So now we are half way through, we just need to things: a controller method that returns the JSON formatted data and the implementation of our helper on the desired view.
I created a new controller called ExampleController which contains a method called Chart, which is responsible of generating the chart's random data an returning the JSON formatted info in order to render the chart.
public string Chart()
{
        // Populating random chart data
        var chartData = new List();
        var rand = new Random(DateTime.Now.Millisecond);
        for (double i = 0; i < 12; i++)
        {
            chartData.Add(rand.Next(30));
        }


        // Creating the chart type definition
        Area area = new Area
                        {
                            Values = chartData,
                            HaloSize = 0,
                            Width = 2,
                            DotSize = 5,
                            FontSize = 12,
                            DotStyleType =
                                {
                                    Tip = "#x_label#<br />#val#",
                                    Type = DotType.DOT,
                                    Colour = "#467533"
                                },
                            Tooltip = "#val#",
                            Colour = "#CC3399",
                            FillColor = "#343399",
                            FillAlpha = .5
                        };

        // Creating the chart object
        var chart = new OpenFlashChart.OpenFlashChart { Title = new Title("line chart") };

        // Setting the Y axis properties
        chart.Y_Legend = new Legend("y axis");
        chart.Y_Axis.SetRange(0, 35, 5);
        chart.Y_Axis.Steps = 3;

        // Setting the X axis properties
        chart.X_Axis.Labels.Color = "#e43456";
        chart.X_Axis.Steps = 4;

        // Defining the chart's tooltip properties
        chart.Tooltip = new ToolTip("#val#")
                            {
                                Shadow = true,
                                Colour = "#e43456",
                                MouseStyle = ToolTipStyle.CLOSEST
                            };

        // Adding the chart type to the elements collection of the chart
        chart.AddElement(area);

        // The library has a built in JSON serializer
        return chart.ToPrettyString();
}
Now we just need to call our Html helper extension method from the view to render the chart like this.
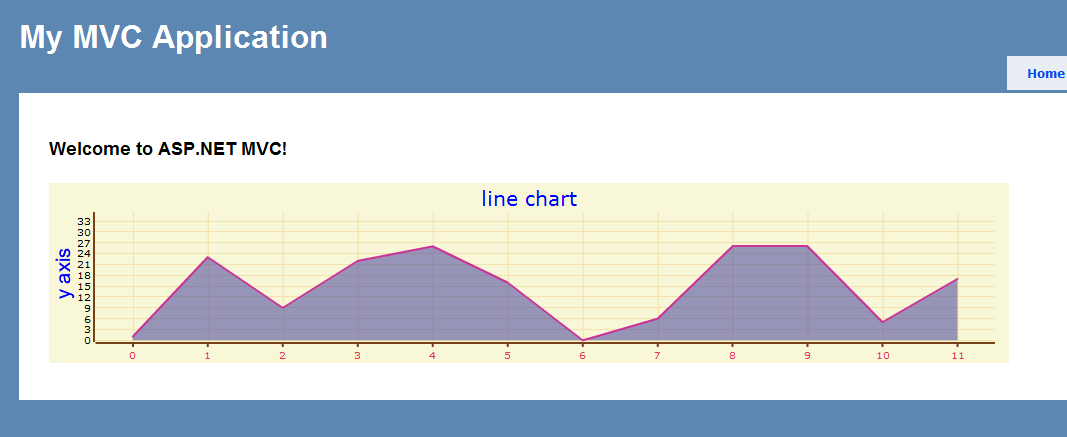
<%= Html.RenderChart("chartContainer", "example/chart", 960, 180) %>
Voila! We’ve got a nice looking chart!
Try reading the tutorials listed on the Open Flash Chart web page where you can learn how to customize its elements.
Summary
All these charting tools are useful and get the job done. They provide us with a set of tools to achieve the data visualization need of our clients. It’s your job to choose the one that suits better your needs.
Taking intoaccount this drawback, havingJavaScriptdisabled on the browser might be a killer for some of the animated charts. This is an inherited issue for all theGooglecharting tools siblings which rely on client-side rendering like Flot or JSCharts. This is where the ASP.NET chart control wins the fight.
I don’t know if there’s a successful web application that doesn't embrace the power of JavaScript, but there are some IE6 users who work for corporations where the IT department don't like JavaScript. I guess these poor people don’t know what they’re missing!
Download the source code.